 Coingecko
Coingecko sorts coin tables by market cap and percentage price change
Coingecko lets you compare coin tables by market capitalization or percentage price change over a selected period. Choose Market Cap to compare circulating valuations, or a percentage column to compare price movements. The comparison also depends on which coins the table includes: sorting the displayed page doesn't establish the largest move across every listed coin.
The useful controls answer different questions. A filter determines which coins qualify, a time window defines the movement, and a sort direction orders the results. Keeping those settings separate makes the table easier to interpret.
A price-change leader only leads within the selected time window and the group of coins that the table includes.
Market Size or Price Movement
Market-cap sorting suits a comparison of circulating valuations, while percentage sorting suits a comparison of recent price performance. The main coin table starts in descending market-cap order. Selecting a price-change column changes the ordering criterion, so smaller assets can appear above larger ones within the displayed group.
The Price column answers a separate question: the quoted value of one unit. A high unit price doesn't establish a high market cap, and a large percentage increase doesn't establish either. Choose the column that answers your question before interpreting the first row. An asset's position has meaning only alongside the metric that put it there.
One Time Window for Every Row
A meaningful performance comparison uses the same period for every coin, with the same quote currency throughout. The table includes short and longer price-change intervals, such as 1h, 24h, and 7d. Those labels describe different measurements, even when they appear beside the same asset.
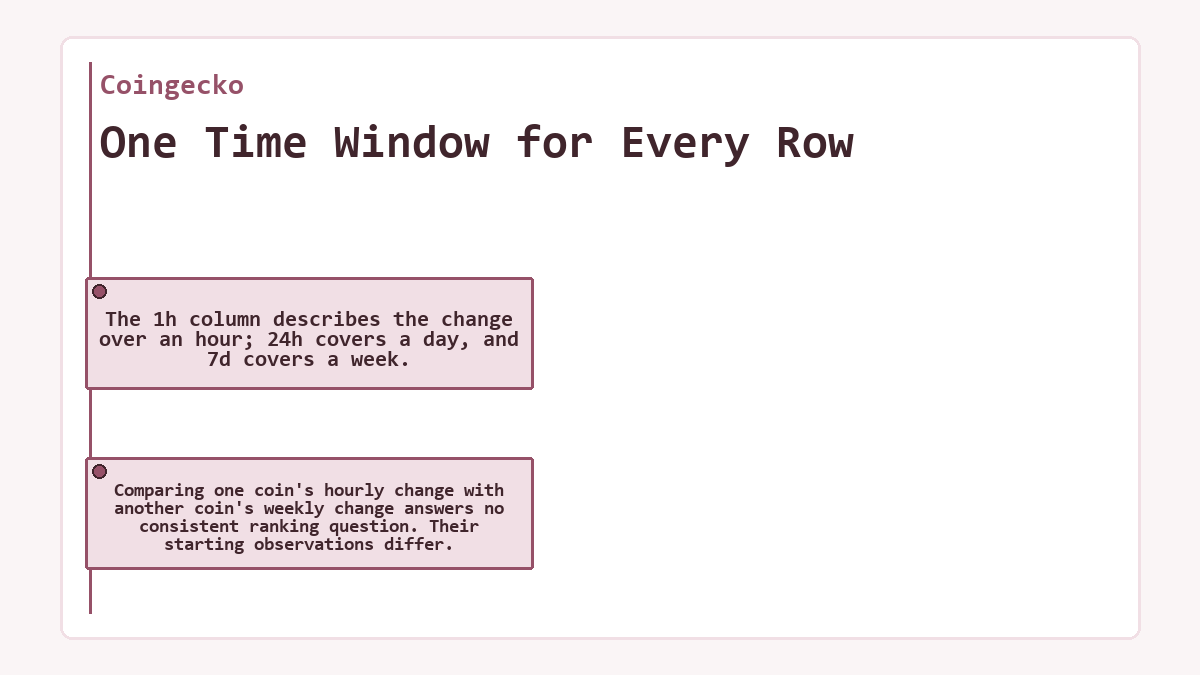
The 1h column describes the change over an hour; 24h covers a day, and 7d covers a week. Comparing one coin's hourly change with another coin's weekly change answers no consistent ranking question. Their starting observations differ.
Percentage change measures the difference between the ending and starting prices relative to the starting price. In symbolic form, it is ((ending price / starting price) - 1) × 100%. This relationship requires a nonzero starting price.
A positive short-period reading can coexist with a negative longer-period reading. The asset may have recovered recently while remaining below its earlier price. Neither figure cancels the other. Choose the period that matches the movement you want to compare, then use the other columns for context.
Ascending and Descending Order
Descending percentage order places higher signed changes first; ascending order places lower signed changes first. Positive changes sit above negative changes in descending order. Among losses, a reading nearer zero represents a smaller decline than a more negative reading.
This distinction matters when every displayed coin has fallen. The first row in descending order may show the smallest loss, rather than a gain. Likewise, ascending order can start with the smallest positive increase when every coin has risen. Read the sign alongside the ordering.
A percentage sort also differs from sorting by the absolute size of a move. A sharp decline belongs near the bottom of descending signed order, even when its magnitude exceeds the gains above it.
Does Sorting Cover Every Listed Coin?
Sorting the main paginated coin table orders the coins available on that page, rather than every listed coin. Pagination therefore forms part of the comparison. A leading percentage on one page can be lower than a leading percentage elsewhere.

The displayed row count also affects how much of the list you can inspect together. Changing it can alter the group available for comparison. The phrase "highest change on this page" makes a narrower claim than "highest change across the market." Keep that distinction when recording a result or comparing screenshots.
A market-cap rank and a row's position after percentage sorting describe different things. The rank can remain attached to the asset while its position changes. Out-of-sequence rank numbers don't, by themselves, show a sorting error.
Filters That Define the Coin Group
Filters narrow the eligible coin group before its ordering becomes useful. Available filters include categories, chains, market-cap ranges, trading volume, and 24h price changes. These controls change membership; selecting a sortable column changes the order of the displayed members.
A market-cap range can keep a price-change comparison within a chosen valuation band. A category filter limits the comparison to that category. Combining conditions narrows it further, so a filtered leader represents that combination of conditions. The comparison doesn't automatically extend to coins that those conditions exclude.
Filter periods deserve particular attention. A 24h price-change filter still selects coins using a daily condition when you inspect their 7d performance. That can be a useful comparison, provided you intend to study weekly performance among coins that satisfy the daily filter.
Visible Columns and Supporting Context
The Customize control changes the table's presentation, including optional metrics and the number of rows. Keep the selected percentage column and Market Cap visible when both matter to the comparison. Trading volume adds context about reported activity. Extra columns help only when their labels remain readable and their values answer a separate question.
Market Cap Beside Unit Price
Market-cap ordering depends on circulating supply as well as price, so it won't necessarily match unit-price ordering. Market capitalization equals an asset's price multiplied by its circulating supply. The supply component explains why comparing the Price column alone cannot reproduce a market-cap ranking.
Fully diluted valuation, or FDV, uses a different supply basis. If that optional column appears, its values aren't interchangeable with circulating market cap. Sorting or interpreting one as the other changes the comparison. Keep the selected valuation label attached to any result that you record.
A missing market cap also differs from a small market cap. Without a usable value, the row can't establish where the asset belongs in a numerical valuation comparison. A displayed price alone doesn't fill that gap.
Gainers and Losers With Their Own Scope
The dedicated Gainers & Losers view suits a search for movers across its selected coin universe. It has separate controls for the time period and the market-cap group. Its results therefore answer a different question from rearranging one page of the main table.
That view also applies a trading-volume eligibility condition, which it states beneath its lists. A coin can have a substantial price movement without qualifying for the displayed results. Read the selected group and the volume condition together before treating an omission as an error.
Use the period labels belonging to that view. Don't assume that another table's column selection carries across, or that every view exposes identical controls.
Can a Blank Percentage Count as No Change?
A blank percentage cannot establish that a coin's price stayed unchanged over the selected period. It provides no numerical change for that comparison. A measured zero, by contrast, represents a calculated result at the displayed precision.
The calculation needs usable price observations at both ends of the interval. Missing history or unavailable data can prevent a meaningful comparison. The blank cell alone doesn't identify which input is missing, so it shouldn't become a guessed gain, loss, or zero.
Blank values also complicate claims about leaders and laggards. A ranking among rows with available percentages says nothing about the performance of rows without them. Preserve that boundary when describing the result.
Changing Values and Apparently Broken Sorts
A changed result can reflect changed market data even when the sorting rule stays the same. Prices and valuations move, while rolling comparison periods acquire new starting and ending observations. A later visit therefore needn't reproduce the earlier order.
Settings can explain differences too. A different page, filter, period, or sort direction changes the comparison before any market movement enters it. Repeatedly toggling a column won't resolve a mismatch between those settings. The useful record includes the coin group, selected metric, direction, and observation time.
If the loaded values still contradict the selected order, preserve those details before refreshing. A screenshot showing the heading and affected rows makes the discrepancy clearer than a screenshot of a coin name alone. Refreshing may obtain a new observation, but it doesn't reconstruct the earlier one.
A Repeatable Price-Change Comparison
Suppose you want the strongest daily performer among the coins on the displayed page, while retaining their market-cap context. Keep the same group in view and compare only rows with a usable daily percentage.
Record the starting page, active filters, quote currency, and observation time. Confirm that the displayed group matches your intended comparison before selecting descending order on the 24h column.
- If you need the largest positive change first, use descending percentage order.
- If the task concerns a valuation band, confirm the market-cap filter before comparing rows.
- If a row lacks a daily percentage, leave it outside the numerical performance conclusion.
- If pagination or filters change, treat the new display as a different comparison group.
- If the top reading is negative, describe it as the smallest displayed loss.
Check that the available daily percentages run from higher to lower within that same group. Record the leading asset with its percentage and market cap. The recorded values describe that observation, rather than a permanent position.
A changed group or a different interval invalidates a direct comparison with the starting record. Keep the ranking's description specific: descending 24h price change among the coins on the recorded page.
Coingecko - common questions
Can I Add Hourly Percentages to Reproduce the Daily Change?
Hourly percentage changes don't add directly to a daily percentage change. Each interval uses its own starting price, so consecutive returns compound. A displayed hourly reading also covers only its particular interval. Use the daily column for the daily comparison rather than adding rounded readings from different observations.
Does a Positive Daily Percentage Mean the Price Rose Throughout the Day?
A positive daily percentage means the ending price exceeds the starting price for that interval. It doesn't describe every movement between those observations. The price may have risen and fallen repeatedly. The percentage column supports an endpoint comparison; the price chart provides context about the path between those endpoints.
Is the table's price-change Percentage the Same as My Portfolio Return?
The table's percentage measures the asset's price movement over its labeled interval, while your portfolio return depends on your recorded transactions. Purchase timing, position size, and costs can make the results differ. Sorting coins by daily performance doesn't establish which holding has contributed most to your portfolio's gain or loss.
Which Column Distinguishes Trading Activity From Circulating Valuation?
The volume column describes reported trading activity over its labeled period, while Market Cap describes circulating valuation. Volume counts trading turnover, so repeated trading can contribute to the total. A volume figure doesn't measure the amount available to buy or sell at the displayed price, and it isn't interchangeable with market cap.
How Can I Document a Suspected Incorrect Figure in a Sorted Table?
Document the affected coin, metric, displayed value, and observation time, together with the table's filters and selected period. A screenshot should include enough surrounding rows and labels to show the discrepancy. If the issue also appears in the coin's chart, include the affected time range when submitting a data-error report.